
The Essential SaaS Metrics Every Founder Should Track Daily
You open your laptop at 6 AM. Three dashboards light up. Your analytics tool shows 47 different charts. Your billing system has another 23 metrics. Your CRM is screaming about conversion rates, pipeline velocity, and 15 other KPIs you bookmarked last quarter.
You’re drowning in data, yet you still can’t answer the one question your board will ask tomorrow: “Are we healthy?”
I’ve seen this movie before. Thirty times, actually—across B2B SaaS companies from seed stage to $50M ARR. Founders tracking everything. Understanding nothing. Making decisions based on gut feel while sitting on terabytes of unused data.
Here’s what nobody tells you: More metrics don’t equal more clarity. They equal more confusion, slower decisions, and a team that stops trusting the numbers entirely.
After three decades building, rescuing, and scaling SaaS operations, I can tell you exactly which metrics matter. Not 47. Not 23. Seven. Just seven metrics that, when tracked daily, give you complete visibility into your business health.
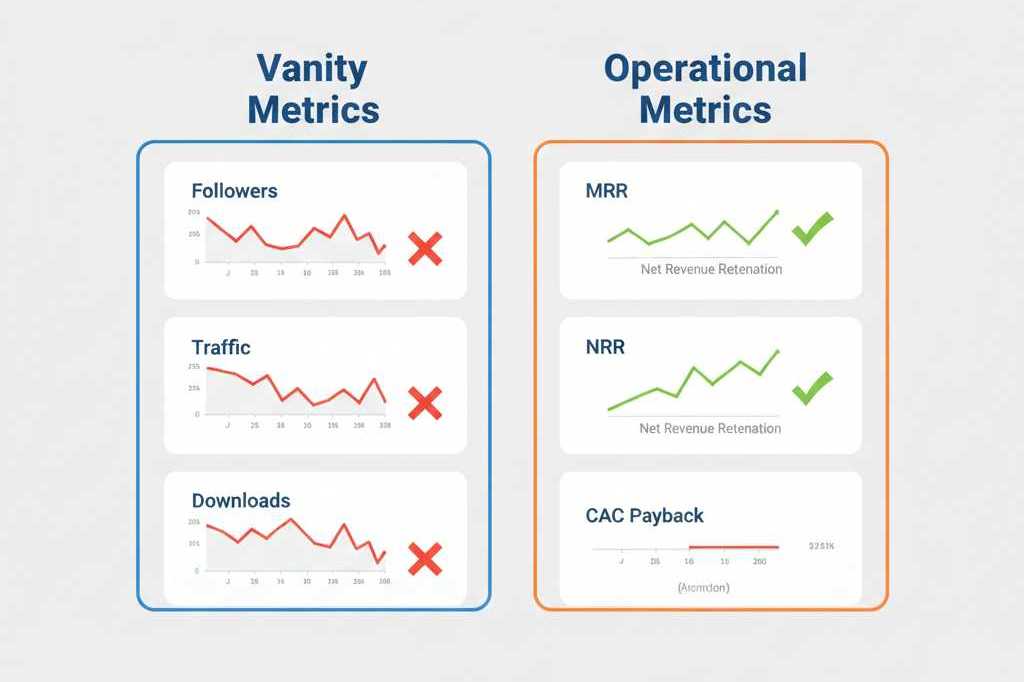
Let me show you the difference between vanity metrics that make you feel good and operational metrics that keep you alive.
The Vanity Metrics Trap: Why Most Founders Track the Wrong Numbers
Let’s start with an uncomfortable truth: You’re probably tracking metrics that actively hurt your decision-making.
Vanity metrics look impressive in board decks. They trend upward. They make for great LinkedIn posts. But they don’t predict revenue, retention, or runway. They’re the business equivalent of checking your social media likes instead of your bank account.
Here’s the test I use with every fractional engagement: Can this metric change your behavior this week? If not, it’s vanity.
Total registered users? Vanity. I worked with a Series A SaaS company celebrating 50,000 registered users while their MRR was stagnant at $180K. Turns out 48,000 of those “users” logged in once and ghosted. The real story was in active engagement—not signup volume.
Website traffic? Vanity (unless you’re a media company). I’ve seen founders obsess over traffic spikes from a viral post while their demo conversion rate plummeted by 40%. Traffic means nothing if it’s the wrong audience.
Social media followers? Pure vanity. Your LinkedIn following doesn’t pay the bills. Your engaged customers do.
Total customers ever acquired? Vanity. This number only goes up, even if 60% churned last quarter. It’s a feel-good metric that hides the bleed.
The pattern? These metrics all share three fatal flaws:
- They’re not actionable – A spike or drop doesn’t tell you what to do tomorrow
- They hide problems – Growing vanity metrics can mask catastrophic operational failures
- They’re easily gamed – Anyone can buy followers, traffic, or fake signups
Operational metrics are different. They’re honest. Brutal, sometimes. But they force you to face reality and make the hard calls that separate successful SaaS companies from the graveyard.
Let me show you what real metrics look like.
The 7 Operational Metrics That Actually Matter
These seven metrics form your founder’s dashboard—the only numbers you need to check daily to know if you’re building a business or just burning cash.
1. Monthly Recurring Revenue (MRR) and Its Three Components
MRR isn’t just a single number—it’s a story told in three parts.
Why it matters: MRR is your heartbeat. Not your current MRR total (that’s a lagging indicator), but how it’s changing through three distinct channels:
- New MRR – Revenue from brand new customers
- Expansion MRR – Upgrades, upsells, additional seats from existing customers
- Churned MRR – Revenue lost from cancellations and downgrades
Here’s the insight nobody shares: The ratio between these three tells you everything about your business model health.
A healthy B2B SaaS company at scale should see expansion MRR offsetting 50-75% of churned MRR. If you’re losing $10K MRR to churn, you should be gaining $5-7.5K from expansions.
Early stage? Different equation. You’ll have minimal expansion and higher churn. That’s expected. But you need to know your baseline so you can track improvement.
The problem I see constantly: Founders celebrating “MRR growth” without looking under the hood. Last month I worked with a company showing 15% MRR growth. Sounds great, right? Except they were acquiring $50K in new MRR while losing $35K to churn. They were running a $600K/year acquisition treadmill just to stay alive.
How to track it: Pull these three numbers daily from your billing system. Plot them on a simple line chart. When churned MRR spikes, you have 30-45 days to diagnose and fix before it becomes a crisis.
What to do when it breaks: If churned MRR is climbing, segment by cohort immediately. Is it a specific customer segment? A pricing tier? A feature gap? The answer changes your response entirely.
2. Net Revenue Retention (NRR)
This is the metric that separates unicorns from strugglers.
Why it matters: NRR tells you if your existing customers are growing with you or dying on the vine. It’s calculated as: (Starting MRR + Expansion – Churn) / Starting MRR × 100.
Best-in-class B2B SaaS companies hit 120%+ NRR annually. That means even if they stopped acquiring new customers entirely, their revenue would still grow 20% year-over-year from expansions alone.
The insight: Companies with NRR above 120% have almost unlimited scaling potential. Companies below 100% are in a leaky bucket, losing revenue faster than they can add new customers. Between 100-110%? You’re stable but not thriving.
The problem: Most founders don’t even calculate NRR until a VC asks for it. By then, you’ve already built the wrong product for the wrong customers at the wrong price point.
How to track it: Calculate monthly. Track the trend. If NRR is declining, your product isn’t solving a growing problem—it’s solving a static or shrinking one.
The fix: NRR below 100% requires product intervention, not just customer success theater. You need to understand why customers aren’t expanding. Usually it’s one of three things: your product doesn’t integrate deeper into their workflow, your pricing doesn’t align with value realization, or you’re solving a point problem instead of a platform problem.
3. Customer Acquisition Cost (CAC) Payback Period
This metric tells you how fast your business can actually scale.
Why it matters: CAC Payback Period measures how many months it takes to recover what you spent acquiring a customer. If you spend $3,000 to acquire a customer paying $500/month, your payback is 6 months.
Top-tier B2B SaaS companies recover CAC in 5-7 months. Mediocre ones take 12-18 months. Dying ones? They never recover it at all.
The critical insight: Your CAC Payback Period determines your maximum growth rate. If payback takes 12 months and you’re burning cash, you physically cannot outrun your burn rate through growth. The math doesn’t work.
The problem I see: Companies comparing CAC to Customer Lifetime Value (LTV) instead of looking at payback speed. A 5:1 LTV:CAC ratio sounds amazing, but if payback takes 24 months and you have 8 months of runway, you’re dead before you see the return.
How to track it: Take total Sales & Marketing spend for a month. Divide by new customers added that month. That’s your CAC. Then divide CAC by your average MRR per customer. That’s your payback in months.
Track this monthly. Watch for trends. If payback is extending, your unit economics are deteriorating—even if revenue is growing.
The fix: Most CAC problems are actually qualification problems. You’re letting too many wrong-fit customers into the funnel. Tighten your ICP, increase pricing for better-fit segments, or reduce acquisition spend on low-value channels.
4. Active User Engagement Rate
This is your early warning system for churn.
Why it matters: Usage predicts retention. Customers who don’t use your product don’t renew. Simple as that.
But here’s the nuance: “active” means different things for different products. For a daily workflow tool, active might mean 20+ days/month. For a quarterly reporting tool, it might be 4-6 sessions/quarter.
Define it for your business: What’s the minimum usage pattern that correlates with renewal? That’s your active threshold.
I use a 30-60-90 day rule: Track login frequency at 30, 60, and 90 days post-purchase. Accounts that don’t hit your “active” threshold by day 90 have a churn risk 3-4x higher than engaged accounts.
The problem: Founders track total users or MAU (Monthly Active Users) without defining what “active” really means. Having 10,000 MAUs means nothing if 9,500 logged in once to check a single report.
How to track it: Pull daily active user counts from your product analytics. Segment by customer size, vertical, and cohort. Look for patterns. Which segments have the highest engagement? Which are sleepwalking toward churn?
The fix: Low engagement is almost always an onboarding problem. Your customers don’t understand how to extract value. Build better activation experiences. Create forcing functions that push users toward their first “aha moment” faster.
If engagement is low across the board? You have a product-market fit problem, not an onboarding problem. Time for hard conversations about pivots.
5. Gross Margin
This metric tells you if you have a software business or a consulting business in disguise.
Why it matters: Gross margin reveals your true unit economics after you strip out the cost of delivering your product. For SaaS, this includes hosting costs, third-party software fees, and direct customer support costs.
Healthy SaaS companies operate at 75-85% gross margins. If you’re below 70%, you’re in trouble. Below 60%? You’re not running SaaS—you’re running a high-touch service business with software window dressing.
The brutal truth: I’ve worked with “SaaS” companies at 45% gross margins. Every dollar of revenue growth required 55 cents of direct costs. They were scaling their way to bankruptcy.
The problem: Low gross margins often stem from “strategic” decisions that sound smart but kill unit economics:
- Offering unlimited white-glove onboarding to every customer
- Building custom integrations for individual clients
- Running expensive infrastructure because “we’ll optimize later”
- Providing 24/7 support for a $99/month product
How to track it: Calculate monthly. Total revenue minus cost of goods sold (hosting, third-party tools, direct support costs), divided by total revenue.
The fix: This is painful but necessary:
- Automate onboarding and support with self-service resources
- Say no to custom development for individual clients (or charge 10x)
- Right-size your infrastructure—you don’t need five nines uptime for a $50/user/month tool
- Tier support by plan level
If gross margins won’t budge above 70% after 12 months of optimization, you need to 3x your pricing or change your business model. There’s no middle ground.
6. Cash Runway
The only metric that matters when you’re about to run out.
Why it matters: Cash runway tells you how many months you can operate before hitting zero. It’s the difference between controlled growth and emergency mode.
Most founders calculate this wrong. They divide current cash by average monthly burn and call it done. But burn rate isn’t static—it accelerates as you grow.
How to track it properly: Project cash based on three scenarios:
- Best case: Hit your growth targets, close that enterprise deal, expansion MRR comes through
- Base case: Current trajectory continues, no surprises either way
- Worst case: Churn spikes 30%, new sales dry up for two months, that big renewal falls through
You need 12+ months of runway in your worst-case scenario. 6-8 months is survival mode. Less than 6? You’re in crisis.
The problem: Founders going into board meetings with “12 months of runway” based on best-case assumptions. Reality hits, assumptions fail, and suddenly you’re doing a down round at 90 days of cash.
The fix: Extend runway before you need to. Cut burn by 20% when you have 18 months left, not 6. Raise your next round when you have 10-12 months of runway, not when you’re desperate with 4 months left.
7. Quick Ratio (Growth Efficiency)
This metric separates sustainable growth from the “grow at all costs” graveyard.
Why it matters: Quick Ratio measures how efficiently you’re growing relative to churn. Formula: (New MRR + Expansion MRR) / (Churned MRR + Contraction MRR).
A Quick Ratio of 4 means you’re adding $4 of new/expansion revenue for every $1 you lose to churn. That’s rocket fuel. A ratio of 1? You’re running in place. Below 1? You’re shrinking despite adding new customers.
Top-performing SaaS companies maintain Quick Ratios of 3.9+. Get above 4, and you’re in elite territory.
The insight: Quick Ratio reveals whether growth is masking fundamental problems. You can have 20% MRR growth with a Quick Ratio of 1.2 (barely sustainable) or 15% growth with a ratio of 5 (incredibly healthy).
The problem: Nobody tracks this until a VC brings it up during diligence. By then you’ve built an unsustainable growth model.
How to track it: Calculate monthly. When Quick Ratio trends down, it’s screaming that you have a retention or expansion problem that new customer acquisition is temporarily hiding.
The fix: Quick Ratio below 2 requires immediate intervention. You’re probably:
- Acquiring wrong-fit customers who churn quickly
- Pricing too low to support customer success investments
- Lacking product features that drive expansion
- Ignoring customer feedback until they churn
Fix retention and expansion before you scale acquisition. Otherwise, you’re just filling a leaky bucket faster.
Daily, Weekly, Monthly: The Right Cadence for Each Metric
Not all metrics deserve daily attention. Some need weekly check-ins. Others are monthly strategic reviews.
Here’s the cadence that works:
Daily Check (5 minutes)
- MRR components (new, expansion, churned)
- Active user engagement rate
- Cash balance
Why daily: These metrics change fast and require immediate response. A spike in churned MRR or drop in engagement gives you 24-48 hours to intervene before the damage compounds.
How to do it: Build a single-screen dashboard showing these three metrics with 7-day and 30-day trend lines. Review it with your first coffee. If something’s off by more than 15%, investigate immediately.
Weekly Review (30 minutes)
- CAC Payback Period
- Quick Ratio
- Cash runway projection
Why weekly: These metrics reveal trends but don’t require daily intervention. Weekly check-ins let you spot deterioration early enough to adjust.
How to do it: Friday afternoon, review the week. Compare to last week, last month, same week last quarter. If trends are negative for two consecutive weeks, schedule a deep dive.
Monthly Strategic Review (90 minutes)
- Net Revenue Retention
- Gross Margin
- Full financial health check
Why monthly: These are your strategic compass metrics. They change slowly but reveal fundamental business model health.
How to do it: First week of each month, review previous month’s performance. Look for patterns across quarters. Compare to your annual targets. This feeds your board updates and strategic planning.
The critical mistake: Founders who check everything daily suffer from analysis paralysis. Founders who only look monthly miss early warnings. Cadence discipline is as important as choosing the right metrics.
Leading Indicators That Predict Problems 30 Days Out
The real power isn’t in tracking metrics—it’s in predicting what’s coming before it hits your P&L.
Here are the leading indicators I watch obsessively:
1. Login Frequency Decline (60 Days to Churn)
When customer login frequency drops 30% or more over two consecutive weeks, you have a 71% probability they’ll churn within 60 days.
What to track: Weekly logins per account, segmented by cohort and plan tier.
Early intervention: At 20% decline, trigger automated engagement campaigns. At 30% decline, assign to customer success for direct outreach.
2. Feature Adoption Below 30% (90 Days to Churn)
Customers who don’t adopt core features within 90 days have an 80% correlation with first-year churn.
What to track: Percentage of customers using your top 3-5 core features by day 30, 60, and 90.
Early intervention: Build onboarding that forces first use of core features within 14 days. If they don’t activate, pause acquisition and fix onboarding.
3. Support Ticket Spike (30-45 Days to Churn)
When support tickets from an account triple within a week, especially tickets from executive contacts, you have 30-45 days before they start evaluating alternatives.
What to track: Support ticket volume and sentiment by account. Flag executive contacts opening tickets.
Early intervention: Executive outreach within 24 hours. Don’t just fix the issue—understand the underlying frustration.
4. Payment Failure Patterns (14-21 Days to Voluntary Churn)
Failed payments aren’t always credit card issues. Sometimes they’re intentional non-payment while customers evaluate alternatives.
What to track: Failed payment attempts, especially from previously reliable accounts.
Early intervention: Don’t just retry the card. Have customer success reach out to confirm everything’s working well. Often you’ll uncover dissatisfaction before they formally cancel.
5. Expansion MRR Velocity Slowing (60 Days to Growth Stall)
When expansion MRR growth rate declines for two consecutive months, your overall MRR growth will stall within 60 days.
What to track: Month-over-month expansion MRR growth rate.
Early intervention: Review product roadmap. Are you building features that drive expansion? If not, you’re building features that increase costs without increasing revenue.
The pattern: These leading indicators give you intervention windows. The worst thing you can do is wait for lagging indicators (like churned MRR) to tell you what happened last month. By then it’s too late.
Building Your Founder’s Dashboard in Under 2 Hours
You don’t need expensive BI tools or a data team. You need seven numbers, three time frames, and basic spreadsheet skills.
Here’s how to build it this afternoon:
Step 1: Choose Your Data Sources (15 minutes)
You need exactly three sources:
- Billing system (Stripe, Chargebee, etc.) for MRR components
- Product analytics (Amplitude, Mixpanel, basic SQL) for engagement
- Accounting system (QuickBooks, Xero) for costs and cash
Don’t overcomplicate this. If you can’t pull these numbers in 15 minutes, your data infrastructure needs fixing before dashboard-building.
Step 2: Build the Template (45 minutes)
Create a single spreadsheet with seven tabs:
- MRR Components (New, Expansion, Churned)
- NRR Calculation
- CAC & Payback
- Engagement Rate
- Gross Margin
- Cash Runway Scenarios
- Quick Ratio
Each tab should have:
- Current month’s numbers
- 3-month rolling average
- Year-over-year comparison
- Simple visualization (line chart or bar chart)
Pro tip: Color code everything. Green for healthy, yellow for watch, red for action required. Your dashboard should scream at you when something’s wrong.
Step 3: Set Your Thresholds (30 minutes)
For each metric, define three zones:
Green Zone (Healthy):
- MRR growth >10% monthly
- NRR >110%
- CAC Payback <7 months
- Engagement >70% of active threshold
- Gross Margin >75%
- Cash Runway >12 months (worst case)
- Quick Ratio >3
Yellow Zone (Watch):
- MRR growth 5-10% monthly
- NRR 100-110%
- CAC Payback 7-12 months
- Engagement 50-70% of active threshold
- Gross Margin 65-75%
- Cash Runway 8-12 months
- Quick Ratio 2-3
Red Zone (Action Required):
- MRR growth <5% monthly
- NRR <100%
- CAC Payback >12 months
- Engagement <50% of active threshold
- Gross Margin <65%
- Cash Runway <8 months
- Quick Ratio <2
Adjust these for your specific business stage and model, but start here.
Step 4: Automate the Inputs (30 minutes)
Don’t manually update this daily. That’s a recipe for abandonment.
Options:
- Simple: Export CSVs from your tools weekly, paste into your spreadsheet
- Better: Use Zapier or Make.com to push data to Google Sheets automatically
- Best: Simple Python script (ChatGPT can write this for you) that pulls from APIs and updates daily
The goal: Your dashboard should update with zero manual work. You just review it.
Step 5: Schedule Review Rituals (5 minutes)
Set three calendar blocks:
- Daily 6:15 AM: 5-minute glance at daily metrics (MRR, engagement, cash)
- Friday 4:00 PM: 30-minute weekly review
- First Monday of month: 90-minute deep dive
Block this time like you block investor meetings. If you don’t schedule it, you won’t do it.
The mistake: Building an impressive dashboard you check once a quarter. Better to have an ugly spreadsheet you review religiously than a beautiful Tableau dashboard that gathers dust.
When DIY Isn’t Enough: Why Founders Hire Fractional Operators
Here’s when you should stop trying to figure this out alone:
Problem 1: You Have the Dashboard But Don’t Trust the Numbers
You’ve built the metrics dashboard. The numbers are updating. But you don’t believe them.
Maybe your MRR calculation is including one-time fees. Or your engagement definition is too loose. Or your gross margin excludes costs it should include.
The symptom: You’re making decisions based on gut feel instead of data because you know something’s off but can’t pinpoint what.
The cost of doing it wrong: I’ve seen companies raise $5M Series As based on inflated MRR that included professional services revenue. When the truth came out during B round diligence, the deal fell apart. Two years of momentum destroyed by bad metrics definitions.
Why a fractional operator: Someone who’s set this up 30 times knows exactly where the bodies are buried. We’ll audit your definitions, fix the calculation errors, and build metrics you actually trust in about two weeks.
Problem 2: The Metrics Show Problems But You Don’t Know What to Fix First
Your dashboard is red across the board. Churn is up. CAC is extending. NRR is declining. Cash runway is shrinking.
You’re paralyzed by too many problems and not enough bandwidth to fix them all.
The symptom: You’re chasing symptoms instead of root causes. Throwing money at sales when the real problem is product-market fit. Building features customers say they want instead of features that drive retention.
The cost of doing it wrong: A growth-stage SaaS company I worked with had 12-month CAC payback and thought it was a sales efficiency problem. They doubled their sales team. Payback extended to 18 months because they were acquiring wrong-fit customers faster. They burned $2.4M solving the wrong problem.
Why a fractional operator: Pattern recognition. After 30 years, I can look at your seven metrics and tell you exactly which two levers will unlock the next stage of growth. Usually it’s counterintuitive—the thing you’re avoiding because it’s hard.
Problem 3: You’re Making Unforced Errors That Cost 6-18 Months
The classic mistake: Celebrating vanity metrics while operational metrics deteriorate.
Or the opposite: Over-optimizing a single metric (like CAC) while ignoring the broader system (retention crashes).
The symptom: You’re working incredibly hard, the team is executing, but growth isn’t materializing. Or worse, you’re growing fast but burning cash faster.
The cost of doing it wrong: A Series B company came to me after blowing through $12M in 16 months with minimal revenue growth. Their problem? They’d optimized acquisition spend but neglected onboarding. Their activation rate was 12%. They were filling the bucket without fixing the holes.
Why a fractional operator: You can’t see the system from inside it. You need someone who’s lived through the same growth stages 30+ times and can spot the patterns before they become crises.
The ROI Math That Actually Makes Sense
Here’s the honest economics:
A fractional COO/CTO runs $10-20K per month for a 2-3 day/week commitment. Call it $150K-200K annualized.
A full-time C-level operator runs $250-400K total comp plus 6-12 months to hire and onboard.
But here’s the real calculation:
What’s the cost of getting your metrics wrong?
- Raising at the wrong valuation because your metrics painted a false picture
- Spending 12 months solving the wrong problem
- Burning through runway on growth that isn’t sustainable
- Missing the window to course-correct before metrics become crises
I’ve seen companies waste $1-3M on these unforced errors. A fractional engagement that prevents even one of them pays for itself 10x over.
Plus: You get pattern recognition from someone who’s seen your movie before. We don’t need 6 months to understand your business. We’ve built the same metrics dashboards 30 times. We know exactly where the mistakes hide.
How Cerebral Ops Helps B2B SaaS Founders Get This Right
For 30 years, I’ve been in the trenches with B2B SaaS companies navigating exactly these challenges—from product-market fit through scale-up chaos to sustainable, profitable growth.
At Cerebral Ops, we work with founders and operating partners in that critical $5M-$50M ARR range where you’re too big for gut-feel decisions but too small for enterprise tooling. We specialize in three areas:
Fractional Leadership – We step in as your Fractional CTO, COO, CPO, or CMO to build the operational rigor your company needs without the commitment of a full-time executive hire.
Delivery Rescue – When your product roadmap is off track, your dev team is underwater, and you’re missing commitments to customers and boards, we diagnose what’s broken and rebuild the delivery engine.
Embedded Partner – Sometimes you need more than advice—you need someone embedded in your daily operations, building the systems, coaching the team, and driving execution until you’re ready to hire full-time leadership.
We’ve helped companies rescue failed launches, right-size their tech stacks, build data infrastructure they can trust, and transition from founder-led chaos to operator-led growth.
The metrics dashboard I’ve described? That’s the starting point for every engagement. We audit your current metrics, fix what’s broken, build what’s missing, and train your team to use data for decisions instead of decoration.
If you’re drowning in dashboards but still can’t answer “Are we healthy?”—or if your metrics are showing red flags you don’t know how to fix—let’s talk.
About Cerebral Ops
Cerebral Ops provides Fractional C-level leadership (CTO/COO/CPO/CMO), delivery rescue, and embedded operational partnership for B2B SaaS companies in the $5M-$50M ARR range.
Founded by Deep Janardhanan, we bring 30 years of startup operations and technical leadership experience to companies across the US, UK, EU, Australia, New Zealand, and India—helping founders build sustainable, scalable growth engines without the overhead of full-time executive hires.
We work with venture-backed startups, PE portfolio companies, and bootstrapped SaaS businesses that need senior operational expertise without a 6-month hiring process or full-time commitment.
Ready to build metrics you can trust? Contact us at https://cerebralops.in/contact/.